
Article on Vertical Equity by IAAO Task Force
In the recently released Volume 20, Issue 2 2023 of The Journal of Property Tax Assessment and Administration, The IAAO Statistical Tools and Measures Task Force provided an overview of the standard measures of vertical equity along with some alternative approaches. Each measure was “put through its paces” using a data set crafted to present each model with data demonstrating various expressions of equity and inequity. The tests were documented in detail along with their results.
A few key takeaways from the article are:
- Vertical equity measures can be influenced by the presence of horizontal inequity in the data, so it is important to test for both simultaneously.
- The PRD (a broadly accepted measure of vertical equity) performs best when using boot strap confidence intervals to evaluate the result and worst when drawing conclusions using the standard IAAO interval as a guide.
- The Assessment-to-sales ratio regression on price (ASR) is sensitive to errors in the underlying data (deviation from true market value in the market value proxy) and vulnerable to endogeneity due to the relationship between price and assessed value.
- In addition to ASR, offices should consider adding one or more of the alternative measures to validate vertical equity conclusions.
That alternative equity measures warrant such attention underscores the importance of the standards and the increasing attention being paid to the topic by the public. With the rapid advancement of AI (Artificial Intelligence) and consumer focused analytics tools, the ability of the public to inspect and derive insights from property tax data is increasing. Tax appraisal offices need easy to deploy tools that provide quick insights on both vertical and horizontal equity within their appraisal districts. Farragut has taken up the challenge to provide these tools using our newest platform Arist Analytics for Assessors. In this post we will review the launch version of our newest equity tool set.
A3 (Arist Analytics for Assessors) Equity Tools
Global Overview (Horizontal Equity)
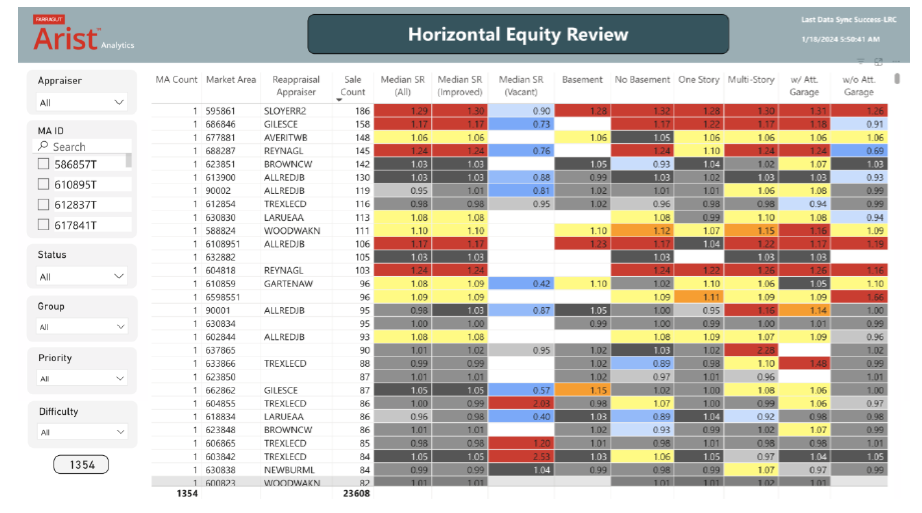
A3’s Horizontal Equity Review tool gives Assessors a rapid overview of median sale ratio across a set of properties grouped by characteristics of importance (as defined by the Assessor). Beginning at the left side of the data table we see the Median Sale ratio for all sales within a given market area. As we move from left to right the median SR is calculated for each of the property groups and then color graded for quick visual identification. This allows an at-a-glance assessment of the state of the market area so decisions can be made, or further clarification sought. In the example above the shading follows this pattern but this can be customized.
Using this standard, in an ideal situation the Median SR across all groups would all be in the range of greys (.95 – 1.05).
Along the left side of the screen a group of filters are provided that allow the user to focus in on specific sets of market areas, such as those being managed by each appraiser or those of a particular priority or difficulty rating. The MA ID filter allows searching and on the fly grouping of market areas.
Median SRs that populate the table are recalculated each time the tool is opened ensuring the analysis provided is always based on the most current data.
Market Area View Horizontal Equity
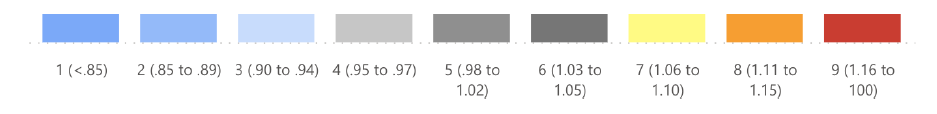
The Horizontal Equity focus tool allows an appraiser to view details on a specific market area and see the distribution of sale ratios across the predefined grading scale. An additional list of filters on the right side of the screen provides the ability to focus in and limit the SR calculation and distribution chart to sales of properties with specific characteristics such as valuation approaches, number of stories, etc. The filters from the Horizontal Equity Review tool are available here as well.
Market Area View Vertical Equity
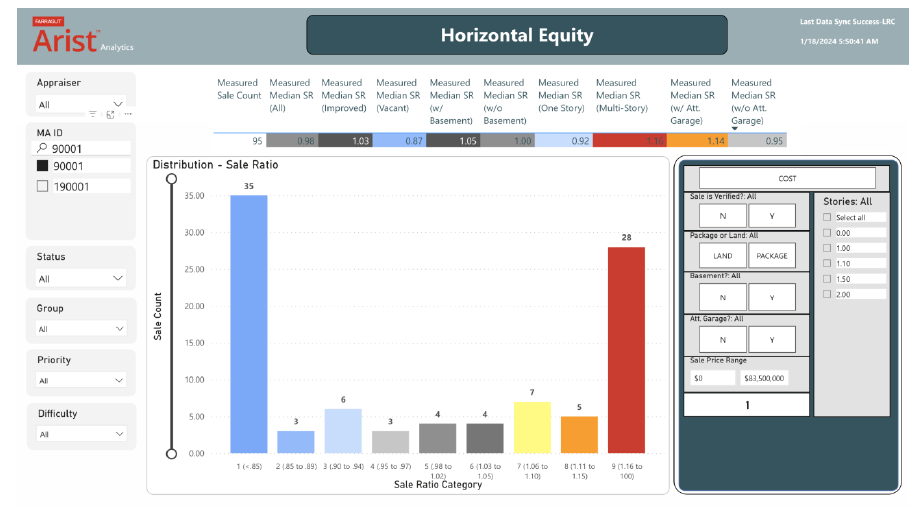
The Vertical Equity Focus tool replicates the filters and format of the Horizontal Equity Focus tool but displays as its central feature a plot of sale ratio vs. sale price. This allows an appraiser to quickly identify trends among the sales of properties in focus. A trend line is calculated based on the filtered data set and .95 and 1.05 boundary lines quickly identify which sale ratios fall outside that range.
In the above example, the Horizontal Equity Data color graded across the top of the screen indicates that multi-story properties appear to be over assessed. In the next screenshot we focus on those sales using the “Stories” filter.
Multi Story Sales:
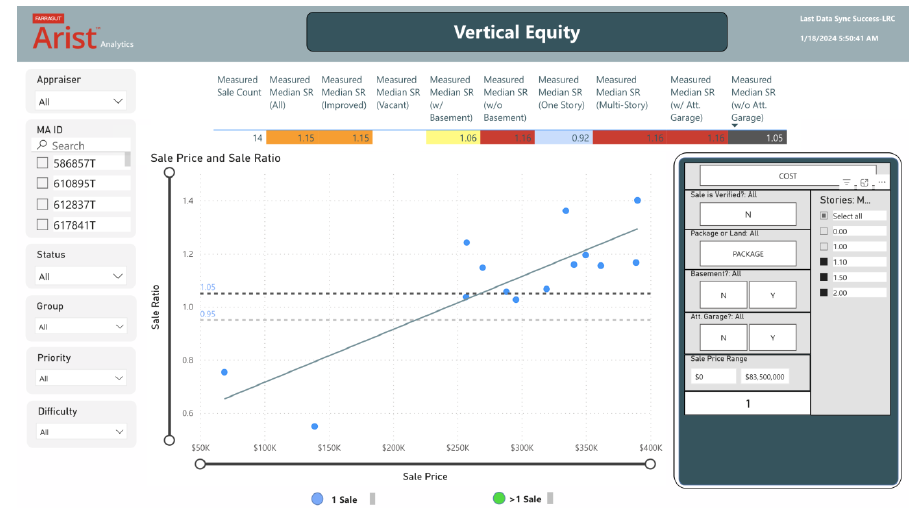
By selecting the properties with stories >1 we see that the sale ratio demonstrates a progressive trend when viewing multi-storied properties. The two sales with lowest sale prices may have some extenuating circumstances that warrant investigation. If desired, they can be excluded from the calculation as outliers by adjusting the sale price filter. Hovering over the data points will provide parcel identifiers so individual sales can be reviewed.
Single Story Sales:
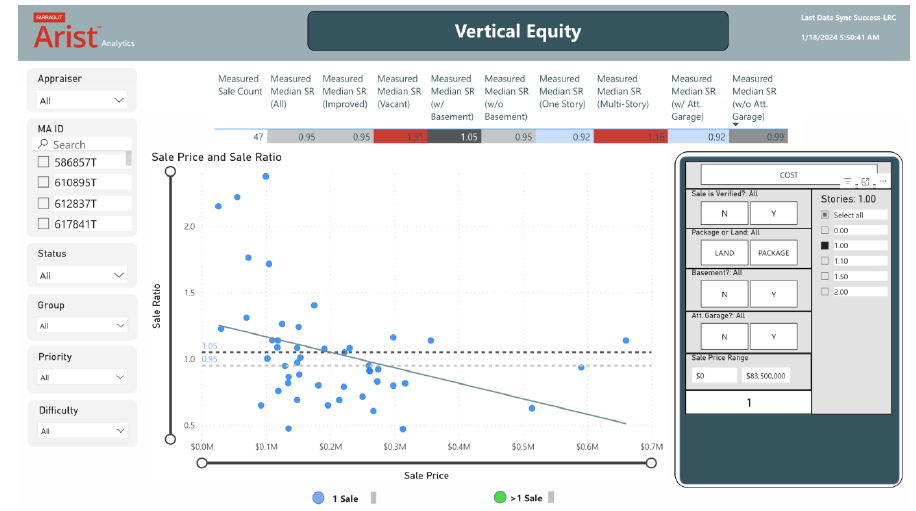
In the screenshot above we have filtered the data to show only sales of single-story homes. A regressive trend appears to be present as the assessment ratio drops as the sale price increases. However, the visual presentation shows that the data set is being influenced by a cluster of higher ratio sales at the lower end of the price range. Those sales warrant investigation before conclusions can be drawn. One of the benefits of using this tool is that it helps expose questions that need to be asked.
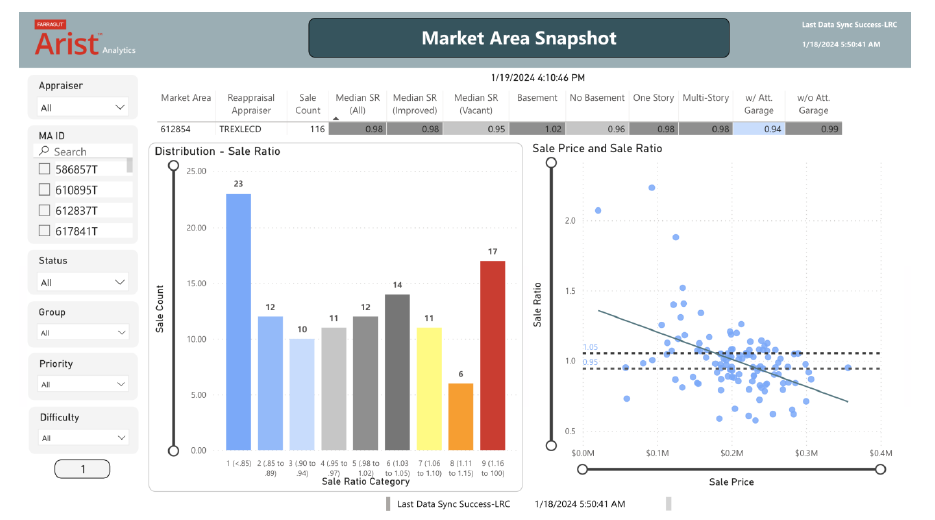
Market Area Snapshot View (Horizontal and Vertical Equity)
As appraisers complete their reviews for each Market Area, A3 provides a simple way to capture the outcome of their efforts using the Market Area Snapshot tool. This graphically displays horizontal and vertical equity side by side for the selected Market Area along with the Median Statistics across the top of the screen. Screen captures are then archived on the market area record or in a document management system for future reference.
The graphic below shows a market area in the process of review.
Future Releases
As we move forward with the evolution of A3, equity will continue to be a focus due to its importance in the appraisal process and the continued growth of public awareness around the topic. Appraisal offices will need to be able to easily demonstrate that Horizontal and Vertical Equity were considered when setting Assessments and that the results of their efforts yielded values that fall within established standards. Farragut is taking on the challenge of making that a simple reality.
On our roadmap for the near future, we will add a Price Related Bias tool to take advantage of that method to reduce sensitivity to endogeneity. In addition, we will continue to expand the testing methods in the tool set adding in some of the alternative methods discussed in the IAAO article.
Personally, I would like to offer my thanks to the authors of “A Review of Vertical Equity Measures in Property Assessments.” Their diligence in exploring measures of vertical equity and demonstrating the strengths and weaknesses of each approach has been enlightening to me. Of greater importance, their insights will serve to improve vertical equity outcomes for tax appraisal offices worldwide.