

Fair and equitable assessment is the standard every jurisdiction is measured against. Whether it’s actually happening across the full range of property values is a different question — and it’s one most offices aren’t set up to answer.
Every assessment office is expected to value property fairly and equitably, regardless of what that property is worth. It’s the standard IAAO holds jurisdictions to, and it’s the standard most offices genuinely intend to meet. But intending to meet a standard and actually verifying you’ve met it are two different things. A well-documented, persistent pattern in mass appraisal is that they often diverge in a specific, predictable direction: lower-value properties assessed at a higher percentage of their true worth than higher-value ones.
National research has already established that this pattern is widespread. What it can’t tell you is which of your parcels are driving it, or what to do about it before your next reappraisal — and that’s a different job entirely, one that has to happen inside the office, on an ongoing basis, not as a one-time public data lookup. That’s where Mass Appraisal Copilot can help.
A regressive pattern hiding in plain sight
The technical term is regressivity: when assessment ratios trend downward as property value trends upward, meaning lower-value homes are effectively over-assessed relative to their actual market worth, while higher-value homes are under-assessed relative to theirs. It’s the opposite of equity, and it’s exactly the kind of pattern that’s easy to miss in an office-wide summary number but obvious the moment you look at ratios broken out by price band.
That’s the catch. A single median ratio for the whole county can look perfectly reasonable while masking a real split underneath it — solid ratios in the middle and upper bands offsetting a real problem at the low end. Without stratifying the data, that split simply doesn’t show up. Yes, it can be difficult to model low-value property, especially when representative sales are often fewer than other price bands, but it can be analyzed.
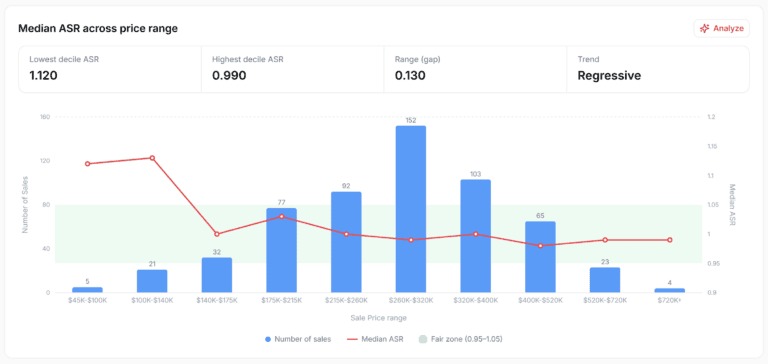
Image: Sales Ratios by Value Band with Median ASR
The median ASR line rises sharply in the lowest price bands, well above the fair zone — a pattern a single, county-wide average would completely hide.
Why it lands hardest at the low end
This isn’t a hypothetical edge case — it’s one of the most consistently documented patterns in property tax administration. The University of Chicago’s Center for Municipal Finance conducted the first nationwide study of assessment regressivity, examining sales and assessment records covering roughly 96% of the U.S. population using nearly 40 million property transactions between 2007 and 2017. The analysis found that the least expensive 10% of homes nationwide were assessed, on average, at 133% of the rate applied to the most expensive 10% of homes — and the researchers found that a property in the bottom 10% of value within a given jurisdiction pays an effective tax rate more than double that of a property in the top 10%. This isn’t confined to a handful of outlier counties: the same research found the pattern present in the vast majority of counties studied nationwide.
Lower-value properties may see less frequent, less detailed reviews than higher-value ones. Fewer appeals get filed on them individually and the dollar amounts involved make each one look small in isolation. But small overages at scale, applied disproportionately to the properties least able to absorb them, add up to a real equity problem — one that’s statistically visible long before it becomes a headline, if anyone’s looking in the right place.
The exposure most offices don’t see coming
This is where the pattern stops being a technical curiosity and starts being a real liability. Regressive assessment invites exactly the kind of scrutiny no office wants: state oversight boards use these same equity measures during reappraisal review, and courts have a track record of taking a hard look at jurisdictions that can’t demonstrate equitable treatment across the value spectrum. An office that’s never checked for this pattern isn’t necessarily failing the standard — but it also can’t prove it’s meeting it, which is a difficult position to be in if anyone asks.
Solution: seeing the split before someone else does
This is precisely the kind of analysis Mass Appraisal Copilot (MA Copilot) is built to make routine rather than rare. Its sales ratio module runs the core IAAO equity measures — Coefficient of Dispersion (COD), Price-Related Differential (PRD), and Price-Related Bias (PRB) — and, critically, breaks them out in a variety of ways, such as by grade, price range, or age, rather than just as a single jurisdiction-wide number.
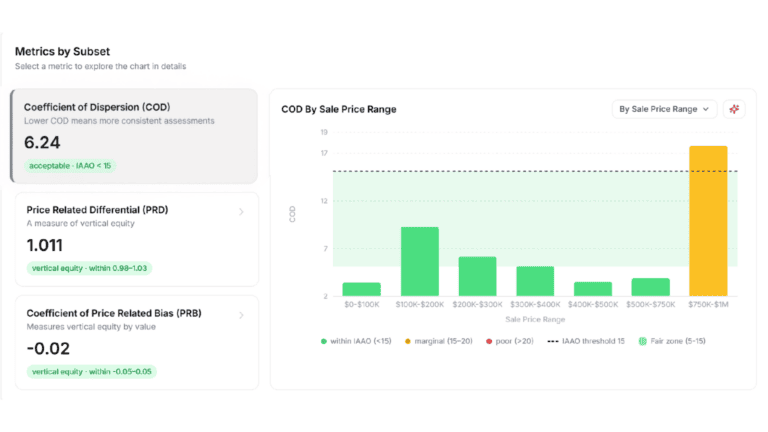
Image: Analysis by Subsets – COD, PRD, and PRB can each be reviewed for instant insights.
Each measure is checked against IAAO thresholds and presented so an appraiser can immediately see the acceptable COD tolerances against the measures for the subsets.
The same view can be sliced further — by neighborhood, building use, or grade — so an appraiser can move directly from “something’s off in the lower bands” to identifying which specific parcels or areas are driving it, without requiring external help or statistical assistance.
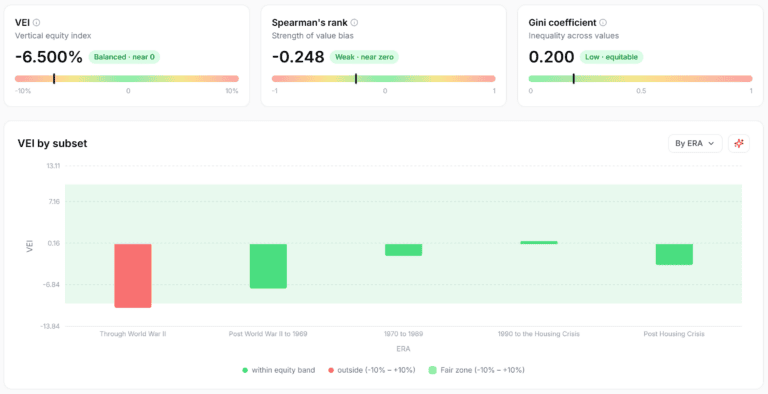
Image: Vertical Equity Analysis by Subset
Additional equity measures — Vertical Equity Index, Spearman’s rank, Gini coefficient — flag exactly which subset is driving the imbalance (here, older properties).
The goal isn’t just catching a problem. It’s catching it before reappraisal, before an appeal, and before a review board asks the question first. It’s also being fair and equitable.
Get an Early Look at Mass Appraisal Copilot
See how your team can uncover data issues, evaluate equity and understand performance faster. Complete the quick form to receive the latest product and launch updates.